Venn Diagram Parodies
Published October 24, 2026
Venn Diagram Parodies are mock Venn charts where unrelated groups share a punchline in the overlapping slice, turning random comparisons into one-line jokes. Online examples go back to a 2006 Indexed post about Santa and the Tooth Fairy2, but the format exploded on Twitter in August 2018 when a diagram comparing preachers, DJs and bank robbers hit thousands of retweets and set off a week of imitation posts1.
Overview
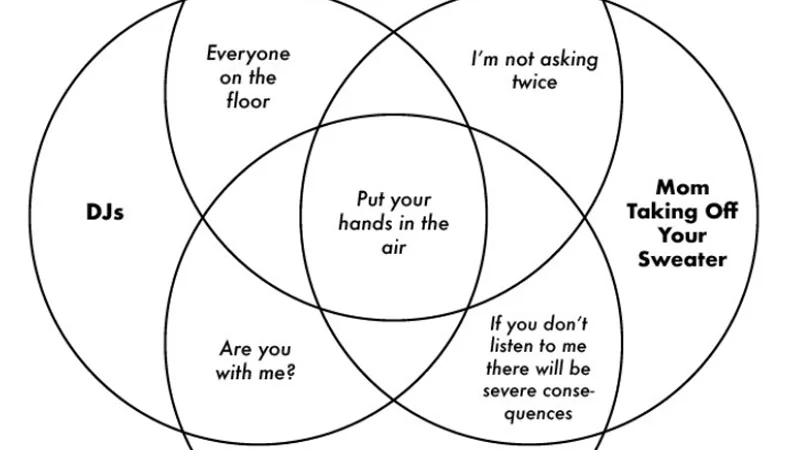
The joke works by picking two or three groups that look nothing alike, then naming what they secretly share where their circles overlap. Each group's label sits in the outer, non-overlapping part of its own circle, and the shared slice carries the actual punchline1. Common targets include religious figures, holiday mascots, and specific social situations like weddings or living with parents4.
Posters typically build Venn Diagram Parodies in simple tools without any illustration. Adam Levy, who made the viral 2018 preachers/DJs/bank robbers chart, told the Daily Dot he threw it together in Google Slides after a group chat joke1. Captions stick to plain text labels and plain circles, since the comparison between the words is the entire gag.
Gallery
Origin & Background
How It Spread
Timeline
How to Use This Meme
To make a Venn Diagram Parody, pick two or three groups that at first glance share nothing, then find a short phrase, object or behavior that quietly applies to all of them. Label each full circle with a group name, place identifying traits for each group in the non-overlapping outer sections, and put the shared punchline in the center where the circles meet1. Common conventions include using three circles rather than two, writing small pairwise punchlines inside each two-way overlap when using three circles, and sticking to plain text with no imagery.
Frequently Asked Questions
References (12)
- 1
- 2
- 3
- 4
- 5
- 6
- 7
- 8
- 9
- 10
- 11
- 12