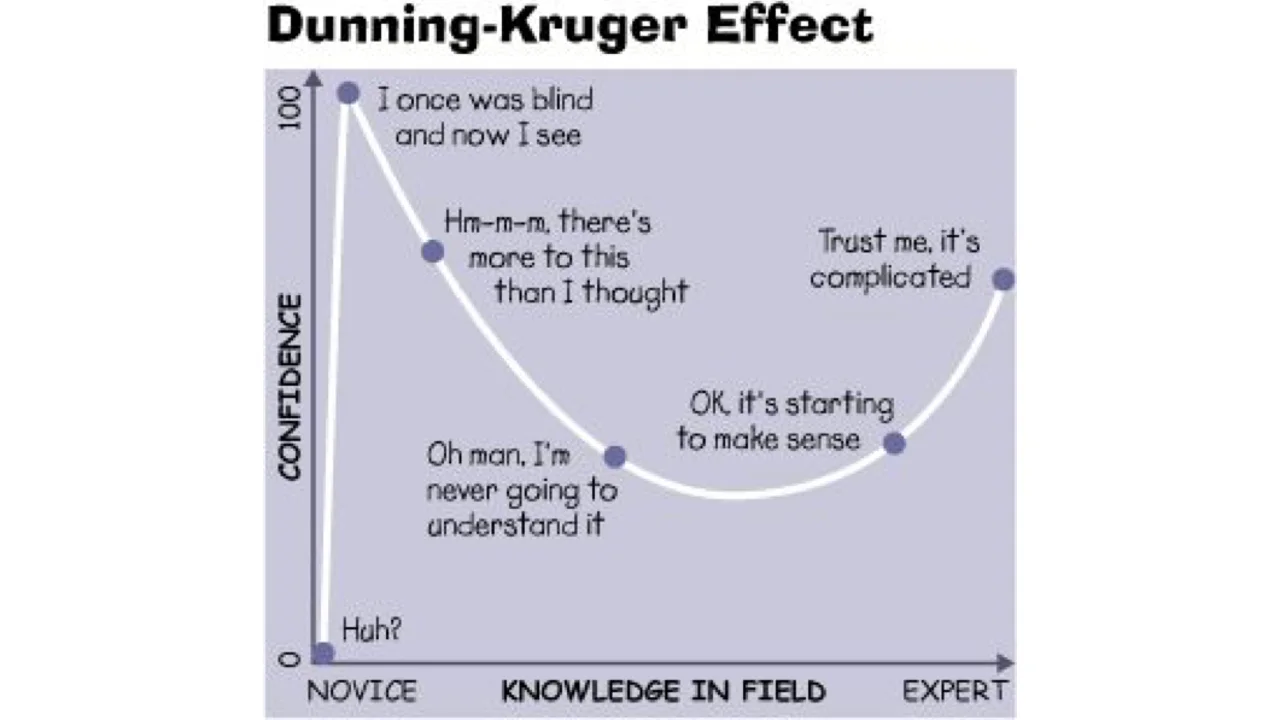
Dunning Kruger Effect

2014image macroclassic

Published August 1, 2026

The Dunning-Kruger Effect is a cognitive bias meme where confidence-versus-competence graphs mock people who overestimate their expertise in a subject. Based on a 1999 Cornell study, it became a widespread reaction image throughout the 2010s, often deployed to call out overconfident posters on Twitter, Reddit, and Facebook.

Overview

The Dunning-Kruger Effect meme takes a cognitive bias from academic psychology and turns it into a visual shorthand for calling someone confidently wrong on the internet2. The image most people recognize is a curve plotting confidence on the y-axis against knowledge or competence on the x-axis, with a tall spike near the start labeled 'Mt. Stupid' or 'Peak of Mount Stupid,' a deep dip called 'Valley of Despair,' and a slow rise toward the 'Slope of Enlightenment'1.

The gag works because the graph looks scientific enough to feel like proof, so posters drop it as a wordless reply when someone in a comment thread confidently botches basic facts5. The underlying bias describes people with limited knowledge in a field who cannot spot their own errors, because the same skills needed to be right in that field are the ones needed to notice they've gone wrong2.

Origin & Background

Platform
Academic paper (1999) / personal blog (2014 meme graph)
Key People
Joseph Paris, based on the 1999 study by Justin Kruger and David Dunning
Date
2014

The Dunning-Kruger Effect started as a paper by Justin Kruger and David Dunning published through Cornell University on November 30, 19992. The pair got the idea after reading about McArthur Wheeler, a Pittsburgh man who robbed a bank in April 1995 with lemon juice smeared on his face, believing the juice would render him invisible to security cameras the way it can act as invisible ink on paper3.

Their study tested Cornell undergraduates on humor, logic, and grammar, then asked participants to rate their own performance. Bottom-quartile students placed themselves in the 62nd percentile on average, while top performers underestimated where they ranked2. Dunning and Kruger called it a 'dual burden': weak performers reach wrong conclusions and lack the metacognitive skill to notice they've done so2.

How It Spread

The graphed meme version took off after Joseph Paris posted 'Lessons from Mt. Stupid' on his consulting blog on September 11, 2014, splitting the effect into stages named 'Setting off on the Journey,' 'Climbing Mt. Stupid,' 'Reaching the Peak of Mt. Stupid,' 'Falling From the Peak,' 'Valley of Despair,' 'Slope of Enlightenment,' and 'Plateau of Sustainability'1. Paris paired the labels with a confidence-versus-wisdom curve, and screenshots of that graph got reposted across LinkedIn, Twitter, and Reddit as a ready-made insult template. Mainstream outlets including The Independent picked up a confidence-versus-competence version, and educational YouTube channels including After Skool in 2019 and Sprouts in 2021 released explainers that pushed the concept into wider circulation3.

Around 2017, blogger BS King of Graph Paper Diaries argued the viral graphs did not match Dunning and Kruger's actual charts, writing that the study only showed subpar performers rating themselves as roughly average rather than ignorant people rating themselves as experts4. TikTok and Instagram Reels later reused Mt. Stupid stills as cutaway shots in videos about self-taught crypto traders and armchair epidemiologists5. The academic backlash grew as well, with McGill University science writer Jonathan Jarry publishing a December 2020 piece arguing the effect might be a statistical artifact of the study design rather than a real bias2.

The template saw a wave of political use during the pandemic era. On October 22, 2021, a Facebook page called 'im not right in the head.com' posted a Mt. Stupid edit placing 'Facebook experts' at the peak and doctors past the Slope of Enlightenment, pulling over 2,500 shares and 6,800 reactions in three months, and follow-up edits calling the platform 'the Dunning-Kruger National Park' spread in late December of that year3.

How to Use This Meme

The typical format takes the Mt. Stupid curve and swaps the y-axis labels for a specific topic like crypto, epidemiology, film theory, or foreign policy1. Creators often mark a red arrow at the peak with a screenshot, name, or username of whoever they're mocking, and sometimes add a second arrow near the Slope of Enlightenment for the people they treat as actual experts5. Text-only versions are common too, where users just reply 'peak Dunning-Kruger' or 'that's Mt. Stupid speaking' under a confident bad take6.

Frequently Asked Questions